If you’ve ever stared at SM50 wondering why one application server is drowning in work while another sits almost idle — you’re not alone. Load imbalance is one of those sneaky performance killers that’s hard to spot until users start complaining. The good news? SAP just gave us a proper tool to diagnose it.
SAP Note 3515065 – Load Balancing Analysis delivers a dedicated analysis program (/SDF/RSLOADANALYSIS) that finally makes load distribution visible and actionable. No more guessing whether your logon groups are actually balanced.
Table of Contents
What Problem Does This Solve?
Let me paint a familiar scene. You have six application servers behind a load balancer. The dispatcher queue on server 3 is through the roof, while server 5 is barely warm. Users hitting server 3 complain about slow response times. Meanwhile, server 5 is practically on vacation.
This happens more often than we’d like to admit. And the root cause isn’t always obvious — maybe a runaway background job, maybe a misconfigured logon group, maybe the delta merge on HANA is hammering one node. Before this tool, you’d piece together the picture from SM50, SM66, ST06, and a healthy dose of experience. That still works, but it’s like diagnosing a car problem by listening to the engine instead of plugging in the OBD scanner.
Prerequisites: Before You Start
Two things need to be in place before the tool will give you useful results:
- Install SAP Note 3515065 — The note delivers the report
/SDF/RSLOADANALYSIS. If you haven’t installed it yet, get your Basis team to pull it in through SNOTE. Straightforward stuff. - Activate snapshot monitoring — This tool relies on snapshot monitoring statistics. If you haven’t enabled it yet, head over to SAP’s official documentation to get it turned on. Without this, the work process analysis section will be empty.
If snapshot monitoring is new territory for you, my earlier post on SAP tracing and troubleshooting covers the monitoring fundamentals that’ll help here.
Running the Analysis: Step by Step
Fire up transaction SE38 and run program /SDF/RSLOADANALYSIS. You’ll see a clean selection screen with two main inputs: date range and delta factor.
Choosing the Right Date Range
Don’t go overboard. Pick the time window where you actually experienced the performance issue. Last 24 hours is usually a good starting point. If the problem is intermittent, try the last 3-5 days to catch multiple occurrences.
The Delta Factor Matters More Than You Think
Here’s where the tool’s default setting will trip you up. The default delta factor is 10 — meaning it considers a server “balanced” if its load is within 10% of the average.
Too idealistic. In real life, 10% variance on a busy system means almost nothing is flagged. Bump it up to 20 or 25 for a more realistic picture. You’ll get cleaner, more actionable results. Trust me on this one — I’ve seen admins run the tool with default settings, see everything marked green, and conclude there’s no problem. The users would disagree.
Understanding the Three Output Sections
The program breaks results into three distinct views. Each one tells a different part of the story.
Section 1: Load Balancing Analysis
This is your high-level overview. You’ll see:
- Batch server groups — How your batch work processes are distributed across servers
- Logon groups — Whether your dialog user logons are spreading evenly
- RFC server groups — If RFC calls are hitting the right targets
Each group shows which servers belong to it and how work is actually flowing. If you see all your heavy users landing on two out of six servers, this view makes it painfully obvious.
Think of it as the “big picture” view. If something looks wrong here, dive into sections 2 and 3 for the why.
Section 2: Work Process Analysis
This is where snapshot monitoring data comes alive. You’ll see actual work process utilization across every application server — drawn from the real monitoring statistics, not estimates.
One thing to watch: the central instance will often show as “not balanced.” That’s normal. The central instance handles the enqueue service and other singleton processes, so its load profile is fundamentally different. Don’t panic and try to “balance” it — that’s fighting the architecture, not fixing a problem.
The work process analysis is where you’ll spot the real issues: a server running at 95% utilization while its neighbor sits at 40%. A dialog work process pool that’s exhausted on one server but has plenty of headroom elsewhere.
This connects closely to the concepts in my post on SAP HANA DBA performance calculations — same principle, just at the application server layer instead of the database.
Section 3: Host Machine Data
This section answers a critical question: are your servers even capable of equal performance?
You’ll see CPU and memory specs for each application server. And here’s where things get interesting — two servers might show identical CPU cores and RAM, but one might be running on older hardware with slower clock speeds or older memory architecture.
Pro tip: If the host data looks identical but you’re still seeing imbalance, run the ABAPMETER tool on each server. ABAPMETER benchmarks actual processing power and will reveal hidden hardware differences that specs alone won’t show.
If a server shows no host data at all, go check ST06 on that host. The operating system-level monitoring agent probably isn’t configured properly, which is a problem on its own.
Putting It All Together: A Real-World Example
Let me walk you through how I’d use this tool in a typical scenario.
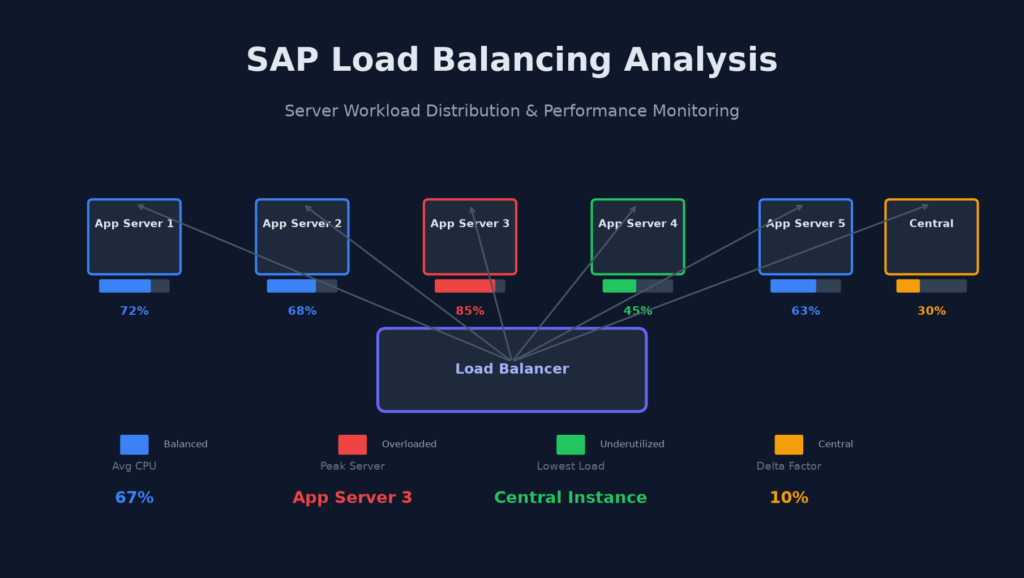
Scenario: Users report intermittent slow response times on the production system. SM50 on server 3 shows all work processes busy. Server 5 looks quiet.
- Run
/SDF/RSLOADANALYSISfor the last 7 days with delta factor 20 - Section 1 (Load Balancing): Logon group “PROD” shows server 3 handling 40% of logons, server 5 handling only 12%
- Section 2 (Work Process): Server 3 consistently at 85-95% utilization during business hours. Server 5 at 30-40%
- Section 3 (Host Data): Both servers show identical specs
Diagnosis: The load balancer is routing too many users to server 3. Either the logon group configuration is wrong, or the message server’s load balancing algorithm isn’t working correctly.
Beyond the Tool: Next Steps
The analysis tool tells you what is happening. Fixing it requires understanding why. Common root causes:
- Stale logon group assignments — Check transaction SMLG. Make sure all application servers are correctly assigned to the right groups.
- RFC routing issues — Inbound RFC calls might be hardcoded to specific servers. Use SM59 to verify RFC destinations use load balancing where appropriate.
- Background job pools — A server dedicated to batch work but receiving dialog logons. Review your server group assignments in RZ04.
- Hardware heterogeneity — Older servers in the group can’t handle the same load. ABAPMETER will confirm this.
For deeper integration with SAP’s broader monitoring ecosystem, the tool feeds into the same snapshot infrastructure used by SAP’s Technical Monitoring Cockpit and the cloud-based monitoring apps. So what you learn here connects directly to enterprise-wide monitoring strategies.
Conclusion
The load balancing analysis tool from SAP Note 3515065 is one of those practical, no-nonsense utilities that should be in every Basis admin’s toolkit. It won’t solve imbalance by itself — but it replaces guesswork with data, and that’s half the battle.
Two things to remember: always increase the delta factor from the default 10, and don’t forget the central instance will naturally look unbalanced. Everything else is actionable intelligence.
Have you used this tool in your landscape? Found any surprising imbalances? Share your experience in the comments below — I’d love to hear what you discovered.